
The Mandelbrot Set Series:
This post is the fifth in a series on the Mandelbrot set. Thus far, we have managed to define the Mandelbrot set as a collection of points or numbers on the complex plane. Every point is either in the set or not in the set, thus the images of the Mandelbrot set that we have created have all been in black and white. Fortunately for all of us who like a little bit of color, there are ways to add a splash of color in a way that are mathematically informative. This post covers one such method.
- Part I: Fractals
- Part II: Exploring the Mandelbrot Set
- Part III: Complex Numbers
- Part IV: Defining the Mandelbrot Set
- Part V: Coloring the Mandelbrot Set
The Escape Time Algorithm
When determining whether or not a point is an element of the Mandelbrot set, we began by defining a sequence. We then looked at the behaviour of that sequence over a large number of terms. One of two things could happen: the sequence could have terms that get farther and farther from the origin, thus “escaping” out to infinity; or the sequence could remain in an orbit near the origin. Points that generate sequences that escape are excluded from the Mandelbrot set, and points that generate sequences with orbits near the origin are included in the Mandelbrot set.
The next logical question might be “If a sequence escapes, how long does it take?”
To answer this question, we first need to make sure that we know what all of our terms mean. Specifically, what does it mean for a sequence to escape, and how are we defining the term “how long.”
In the last post, we declared that any sequence which generates a term greater than 2 units from the origin will eventually escape. That answers the first part of our question: we can determine that a sequence escapes by checking for a term that is greater than 2 units from the origin.
Now all we need to do is figure out what “how long” means. A useful definition is to determine how many terms of the sequence are needed before we get a term that is greater than 2 units from the origin. Consider the following two figures:
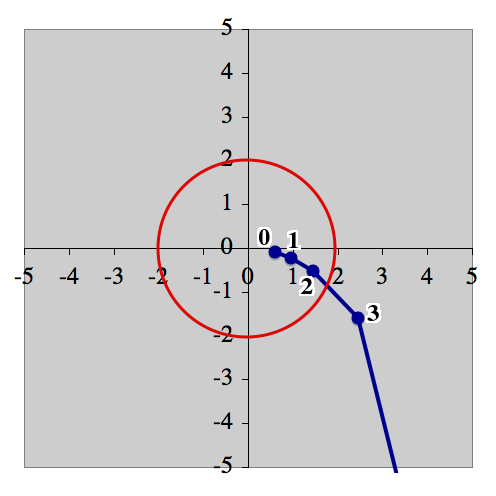
In the first figure, we can trace the sequence from its starting point. The 0th term (the starting point), and the 1st and 2nd terms fall within our circle of radius 2. However, the 3rd term is outside of the circle. This means that the sequence escapes, and that it takes 3 terms before it escapes.
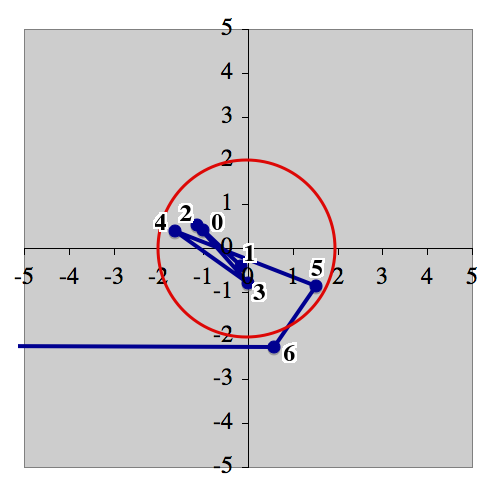
In the second figure, the 0th through 5th terms are in the circle, but the 6th term is outside of the circle. So this sequence also escapes, but it takes longer—six terms, instead of just three.
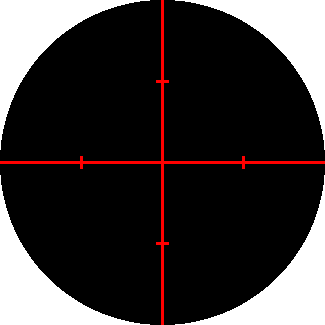
So now we have a workable set of definitions that can be used to answer the question “If a sequence escapes, how long does it take?” The next step is to do something with the question. First, let’s see if we can get a feel for the structure of this process. Let us only consider those sequences which begin outside of our circle of radius 2. We will color those points white, and all other points will be colored black. We get an circle like this:
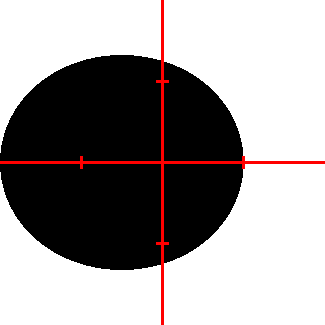
Now consider the sequences that have escaped after the first term of the sequence. These will include all of the above points, plus any additional points that generate sequences that leave our circle of radius 2 after the first term. The images generated is an oval.
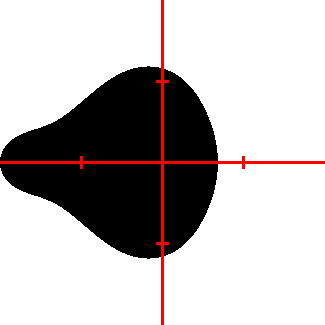
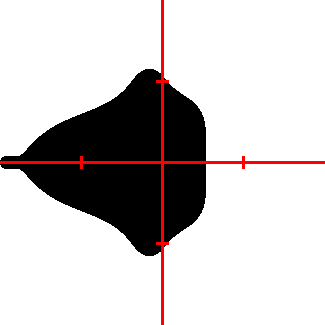
In the next three figures, we consider progressively more terms. In the top figure, we are considering sequences that escape after two terms; in the middle figure, we are considering sequences that escape after three terms; and in the bottom figure, we are considering sequences that escape after four terms.
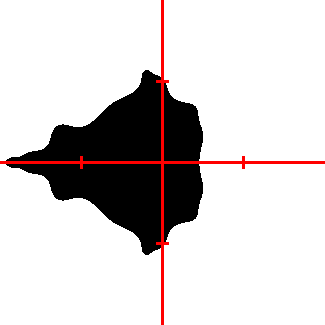
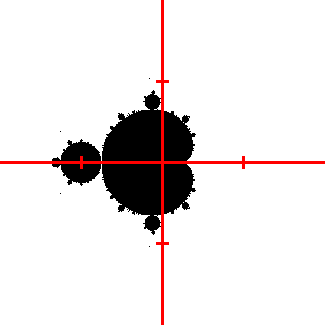
Note that this sequence of images seems to be converging upon the images of the Mandelbrot set from the last post. In fact, that is exactly the case. As we wait longer and longer for sequences to escape, the image that is generated will look more and more like the images of the Mandelbrot set from the last post. For instance, if we wait until the 256th term of the sequence, we get the following image:
Coloring the Mandelbrot Set
Suppose we take the images above for an escape time of 0 to 4 terms, and recolor them. For instance, we could color the white areas in the first image blue, the white areas in the second image aqua, and so on. By “stacking” these images, we might get something like this:
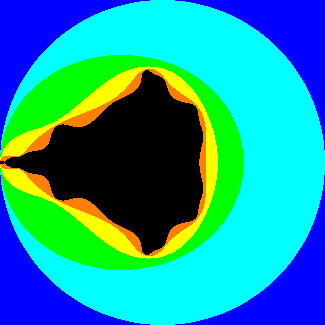
While the colors are a bit garish, we finally have an image of the Mandelbrot set which is not just black and white. In this image, the colors have meaning. Any point in the blue region generates a sequence that has escaped by the 0th term (i.e. it begins outside of our radius 2 circle), while any point in the orange region escapes after the fourth term in the sequence.
Let’s apply the same rainbow color scheme to a maximum escape time of 256 terms. The image we get looks like this:
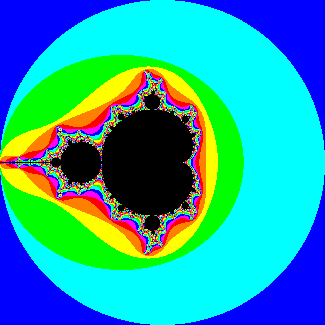
We now have all of the tools that we need to add color to the Mandelbrot set. The actual colors chosen are up to the person generating the image, as the colors themselves have no mathematical meaning—as long as regions with the same escape time have the same color, we have conveyed as much information as is possible using the escape time algorithm.
However, with interesting choices of colors, it is possible to create some truly stunning images. Moreover, color can help us to see some of the very fine structure of the Mandelbrot set. For instance, consider the animation from the second post in this series:
In this animation, we eventually find a miniature copy of the Mandelbrot set, but much of the video is filled with frames that are almost completely blank. How did anyone find this little “minibrot?” From the first frame, it looks like there is nothing there!
The answer is that I started with a colorized version of the Mandelbrot set, and looked for areas that seemed to have some interesting features. The animation below is a frame-for-frame reproduction of the black and white animation above, but colored with various shades of blue.
Conclusion
The Mandelbrot set is found by determining which points on the complex plane generate sequences that escape to infinity when a particular function is applied repeatedly. By noting that any sequence which generates points farther than 2 units from the origin will eventually escape, we can measure how quickly various sequences escape. This gives us a number called the escape time.
If we know that a particular point generates a sequence which escapes, and we know the escape time of that sequence, then we can color that point based upon its escape time. By doing this, pretty spectacular images can be created.
However, it is interesting to note that the colorful points are not actually members of the Mandelbrot set. Points that are colored in the manner described above are actually outside of the Mandelbrot set. These means that the colorful images generated are not really of the Mandelbrot set itself, but of the complement of the Mandelbrot set—that is, the region of the complex plane that is not a part of the Mandelbrot set. This doesn’t really have an effect upon the images themselves, but is, I think, an interesting little mathematical factoid.