The Mandelbrot Set Series:
This post is the second in a series on the Mandelbrot set. In this post, we are going to spend some time exploring the set, in order to get a feel for some of the structures that appear within the Mandelbrot fractal.
- Part I: Fractals
- Part II: Exploring the Mandelbrot Set
Introduction
The Mandelbrot set is a collection of points in the complex plane 1If the complex plane is unfamiliar to you, think back to high school algebra and the Cartesian plane: every point on the plane has an x coordinate, and a y coordinate. The complex plane is very similar to the Cartesian plane, but some mathematical operations are different, and every point has a “real” coordinate, and an “imaginary” coordinate.. We can take any point on the plane, and, with a little bit of work, place that point either inside, or outside, of the Mandelbrot set. In all of the images in this post, points that are inside the Mandelbrot set are colored in black, while points outside the set are colored in white. We’ll get to the pretty colors in a future post.
The Mandelbrot set is also a fractal. As discussed in the last post in this series, a fractal is a geometric entity which displays self-similarity at all scales. At the largest scale, the Mandelbrot set is composed of a large cardioid (heart shaped) region with smaller circles attached at the top and bottom, and to the left. This same cardioid-and-circles structure appears at all scales.
Earlier, we noted that the area of the Koch snowflake is bounded, but that the perimeter or boundary was infinite. The same is true of the Mandelbrot set. However, the Mandelbrot set provides some additional intrigue—there is no known closed formula that can be used to calculate the area 2A closed formula is one that can be expressed using only a finite number of elementary functions (constants, variables, arithmetic (+,-,×,÷), &c.. There is a formula with an infinite number of terms which can be used to estimate the area of the Mandelbrot set, but it converges upon the actual area very slowly. It would take \(10^{118}\) terms just to get the first two digits of the area 3Weisstein, Eric W. “Mandelbrot Set.” From MathWorld–A Wolfram Web Resource. http://mathworld.wolfram.com/MandelbrotSet.html.!
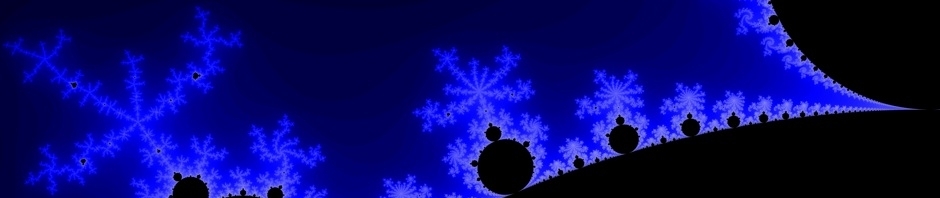
There are other methods which can be used to estimate the area. One such method, pixel counting, generates very high resolution images like those above, then actually counts the number of black pixels. Another method estimates the area of the Mandelbrot set using statistical sampling. Based on these methods, the area of the Mandelbrot set is now known to be very close to 1.506 square units (the total area of the key at the top of this post is about 4 square units, which implies that the Mandelbrot set occupies a bit more than a third of that image).
The Mandelbrot set is, perhaps, one of the most complex monsters of mathematics. In addition to the properties listed above, it has many other quirks and oddities. However, many of these are unlikely to be of great interest to the layperson. So, without further ado, let’s take a look at some of the more visual features of the Mandelbrot set:
A Map of the Mandelbrot Set
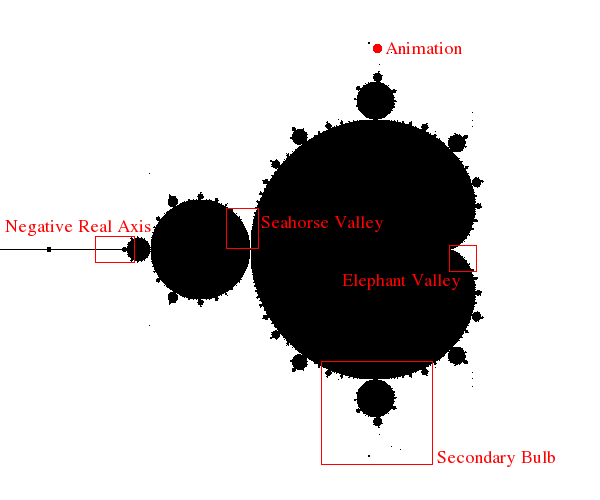
The labeled sections of the image above can be clicked on to go directly to a description and more detailed images. Please note that the boxes above are only approximate, and may not accurately reflect the locations of the images below (though they should be pretty damn close). Feel free to either read through the rest of this post from start to finish, or to use the map above to skip around.
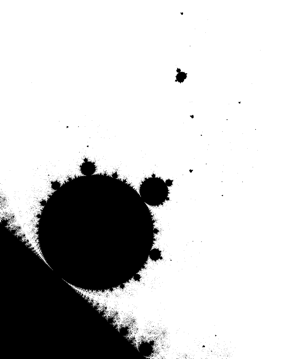
A Secondary Bulb
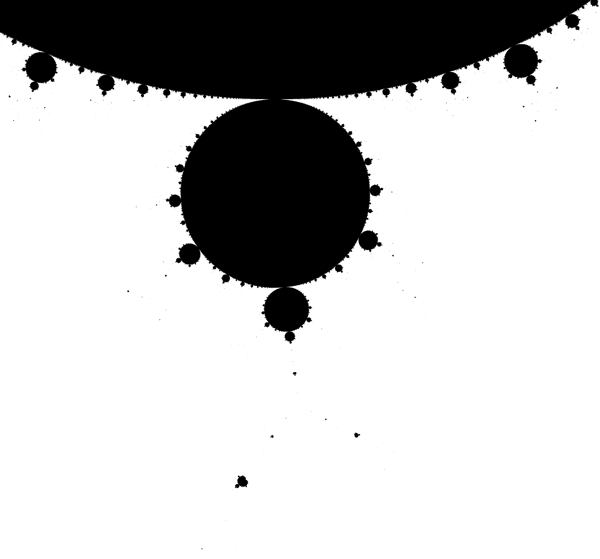
Earlier, we defined fractals in terms of self-similarity at all scales. While this image is not an extraordinary enlargement of the original, it is possible to see some of those self-similar features appearing.
Perhaps the most obvious is the reduplication of circles. The center of the image focuses upon a circle which is attached to the main cardioid of the Mandelbrot set. This same theme—circles attached to cardioids or circles— repeats itself all along the boundary of the Mandelbrot set. ↩
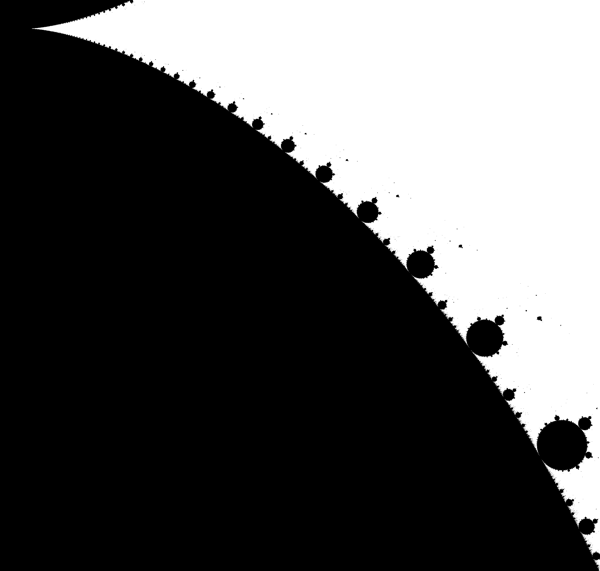
Seahorse Valley
For reasons that won’t become entirely clear until we discuss coloring the Mandelbrot set, this region is called “Seahorse Valley.” For the moment, there are a couple of important features to note.
First, recall that the boundary of the Koch snowflake is made up of equilateral triangles that are all the same. At any scale, we could see those triangles. The boundary of the Mandelbrot set, particularly in this region, seems to be made up of circles-on-circles-on-circles. Each of the large bulbs that you can see has smaller bulbs attached to it, and between each of the larger bulbs is an infinite number of smaller bulbs (you should be able to see this relatively clearly in the upper-left corner of the image).
Second, note that there seem to be a few stray black pixels floating around in the white space. Let’s have a look at one of those:
For instance, the above image shows one of the little black smudges, magnified a great deal (in the center, near the top). It has the same cardioid-and-circles structure of the Mandelbrot set as a whole. The set is self-similar at different scales—wherever you look, you can find mini-brots! ↩
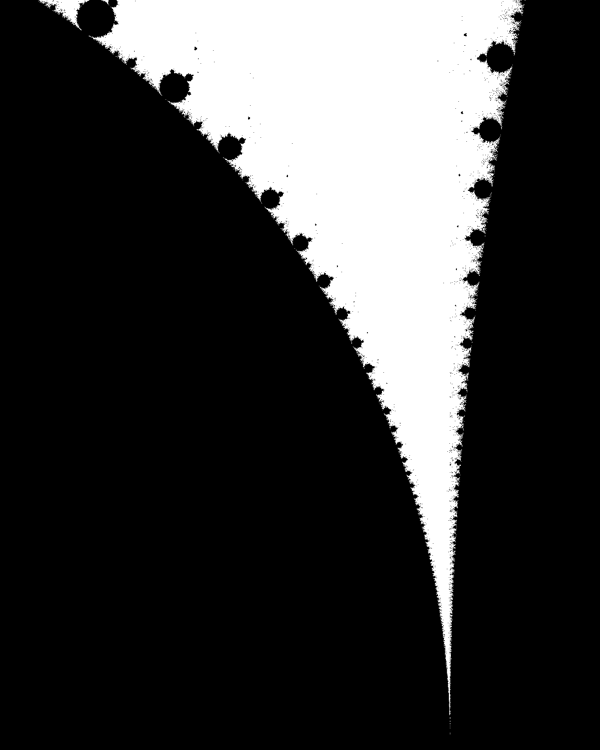
Elephant Valley
Once again, this region carries a name that comes from colorizing the Mandelbrot set: Elephant Valley. Like Seahorse Valley (or, really, any section of the Mandelbrot set near the boundary), the region is characterized by an infinite number of bulbs sprouting from the main bulb of the Mandelbrot set.
One feature of the set (which I think is made abundantly clear in this image) is the infinite number of little bulbs along the boundary. We can see a progression of smaller and smaller bulbs from the right to the left, as well as smaller and smaller bulbs between each of larger features pictured.
Not only do mini-brots occur at all scales, but the boundary is peppered with an infinite number of little bulbs, each looking basically like all of the others. Once again, it is possible to find similar structures and features at all levels. ↩
Negative Real Axis
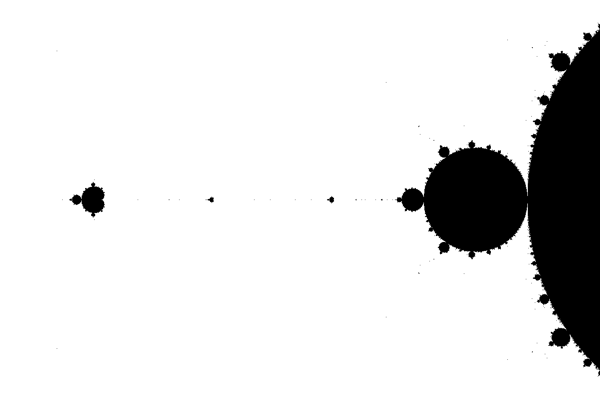
This image is taken from a region along the negative real axis of the complex plane (in Cartesian terms, this is the negative x-axis). A small section of the main bulb of the Mandelbrot set is visible along the right edge of the image, and three more mini-brots off to the left.
This image also demonstrates another important property of the Mandelbrot set: it is symmetrical across the real axis. That is, if you were to print the fractal onto a piece of paper, then fold it in half along the real axis, the two halves would coincide exactly. ↩
An Animation
In this animation, we are zooming in on a region of the Mandelbrot set which is only 0.00004 units wide. In more human terms, this means that if the last frame of the above animation is 1 inch across, then the entire Mandelbrot set, at the same scale, would be on the order of 75,000 inches (about 1.2 miles) across. Or, if you prefer, if the “map” at the top of the page were to be printed on an 8 inch by 6 inch page, the region depicted in the final frame of the animation would be about about 0.0001 inches (about 3 microns) across. A red blood cell could cover the region five times over. If the resolution of your monitor were great enough, you might be able to make out the miniature Mandelbrot set in the animation with a moderately powerful microscope.
In addition to demonstrating the enormous scale that we can encounter while exploring the Mandelbrot set, the animation also shows the required self-similarity at all scales. Consider the first and last frames of the animation. They look very similar—they both have the same basic cardioid shape, and they both have jagged boundaries. The only difference seems to be a matter of rotation. Moreover, these are not the only “copies” of the Mandelbrot set that we see in the animation. I count at least seven recognizable mini-Mandelbrots, as well as several more little black dots which are also little duplicates of the original image. In fact, at any scale, we could find at least one recognizable cardioid (and probably quite a few more). ↩