In the past, I have treated fractals visually. For instance, in my treatment of the Mandelbrot set, I chose points in the complex plane to represent pixels in an image, applied the iterative function \(z_{n+1} = z_{n}^2 + z_0\) to each of those points until the orbit escaped (or failed to escape after a fixed number of iterations), then colored the pixel based on the number of iterations applied before the orbit escaped. Another visual approach was to compute a large number of orbits and treat their traces like photons hitting a light sensor, thus creating nebulabrot images. I have recently started playing around with an entirely different idea: instead of using the orbits to compute values for pixels in an image, the orbits can be used to generate sound.
The approach that I have adopted here is fairly naïve, as my knowledge of music theory is rather lacking. That said, here is what I have done so far:
First, I pick a point in the complex plane and generate the orbit of that point. For instance, consider the point (taken arbitrarily) \(0.375+0.285i\). Iterating the Mandelbrot function 64 times gives us the following sequence of complex numbers, which represents the orbit of the original point:
 0.38 +  0.28*i
 0.43 +  0.50*i
 0.31 +  0.72*i
-0.04 +  0.74*i
-0.17 +  0.22*i
 0.35 +  0.21*i
 0.46 +  0.43*i
 0.39 +  0.68*i
 0.07 +  0.82*i
-0.29 +  0.40*i
 0.30 +  0.05*i
 0.46 +  0.32*i
 0.49 +  0.58*i
 0.28 +  0.85*i
-0.27 +  0.77*i
-0.14 + -0.14*i
 0.38 +  0.32*i
 0.41 +  0.53*i
 0.27 +  0.72*i
-0.07 +  0.67*i
-0.07 +  0.19*i
 0.34 +  0.26*i
 0.43 +  0.46*i
 0.34 +  0.68*i
 0.03 +  0.75*i
-0.19 +  0.33*i
 0.30 +  0.16*i
 0.44 +  0.38*i
 0.42 +  0.62*i
 0.17 +  0.81*i
-0.25 +  0.56*i
 0.13 +  0.01*i
 0.39 +  0.29*i
 0.45 +  0.51*i
 0.31 +  0.74*i
-0.07 +  0.75*i
-0.18 +  0.18*i
 0.38 +  0.22*i
 0.47 +  0.45*i
 0.39 +  0.71*i
 0.03 +  0.84*i
-0.33 +  0.33*i
 0.37 +  0.07*i
 0.51 +  0.34*i
 0.52 +  0.63*i
 0.25 +  0.94*i
-0.45 +  0.76*i
 0.00 + -0.39*i
 0.22 +  0.29*i
 0.34 +  0.41*i
 0.32 +  0.57*i
 0.16 +  0.65*i
-0.02 +  0.49*i
 0.14 +  0.26*i
 0.33 +  0.36*i
 0.35 +  0.52*i
 0.23 +  0.65*i
 0.01 +  0.59*i
 0.03 +  0.29*i
 0.29 +  0.30*i
 0.37 +  0.46*i
 0.30 +  0.62*i
 0.07 +  0.66*i
-0.05 +  0.38*i
 0.23 +  0.24*i
Plotting this renders
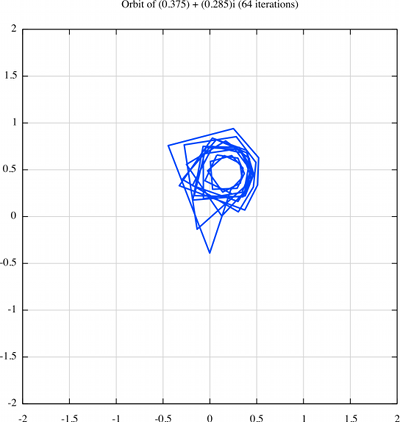
To turn this into sound I divided the complex plane into 24 wedges, each of which is π/12 radians wide. Each wedge corresponds to a different note in a chromatic scale, hence each point in the orbit corresponds to a note. For the duration of each note, I used the distance from the origin with points closer to the origin having a longer duration. The exact details can be found in the program used to generate the music: fractal_music.py. You’ll need python and music21 to make this work.
The result for this sequence is a .midi file (embedded below):
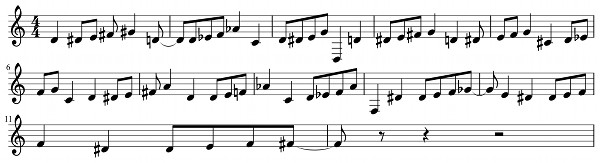
Finally, just for giggles, I typset this sequence of notes using musescore. The result doesn’t look much like music, but is moderately entertaining.
Obviously, there are a lot of parameters here. In the code that generates these “tunes,” there are two obvious parameters: the initial point (the orbits can be quite different depending on what point is chosen) and the number of iterations (more iterations give longer pieces of “music”). There are also some not-so-obvious changes that could be made. Instead of looking at the points themselves, the note generated could depend on the change in position (i.e. the difference between two consecutive points in an orbit). The interpretation of phase and modulus could be exchanged, or the Cartesian (rather than polar) coordinates of each point could be used in some manner. If anyone plays with this at all, please let me know—I would love to hear the results.