
Image Details
The above image is a scaled version of a larger image. Click the image above to obtain the full version (approx. 7.6 MB).
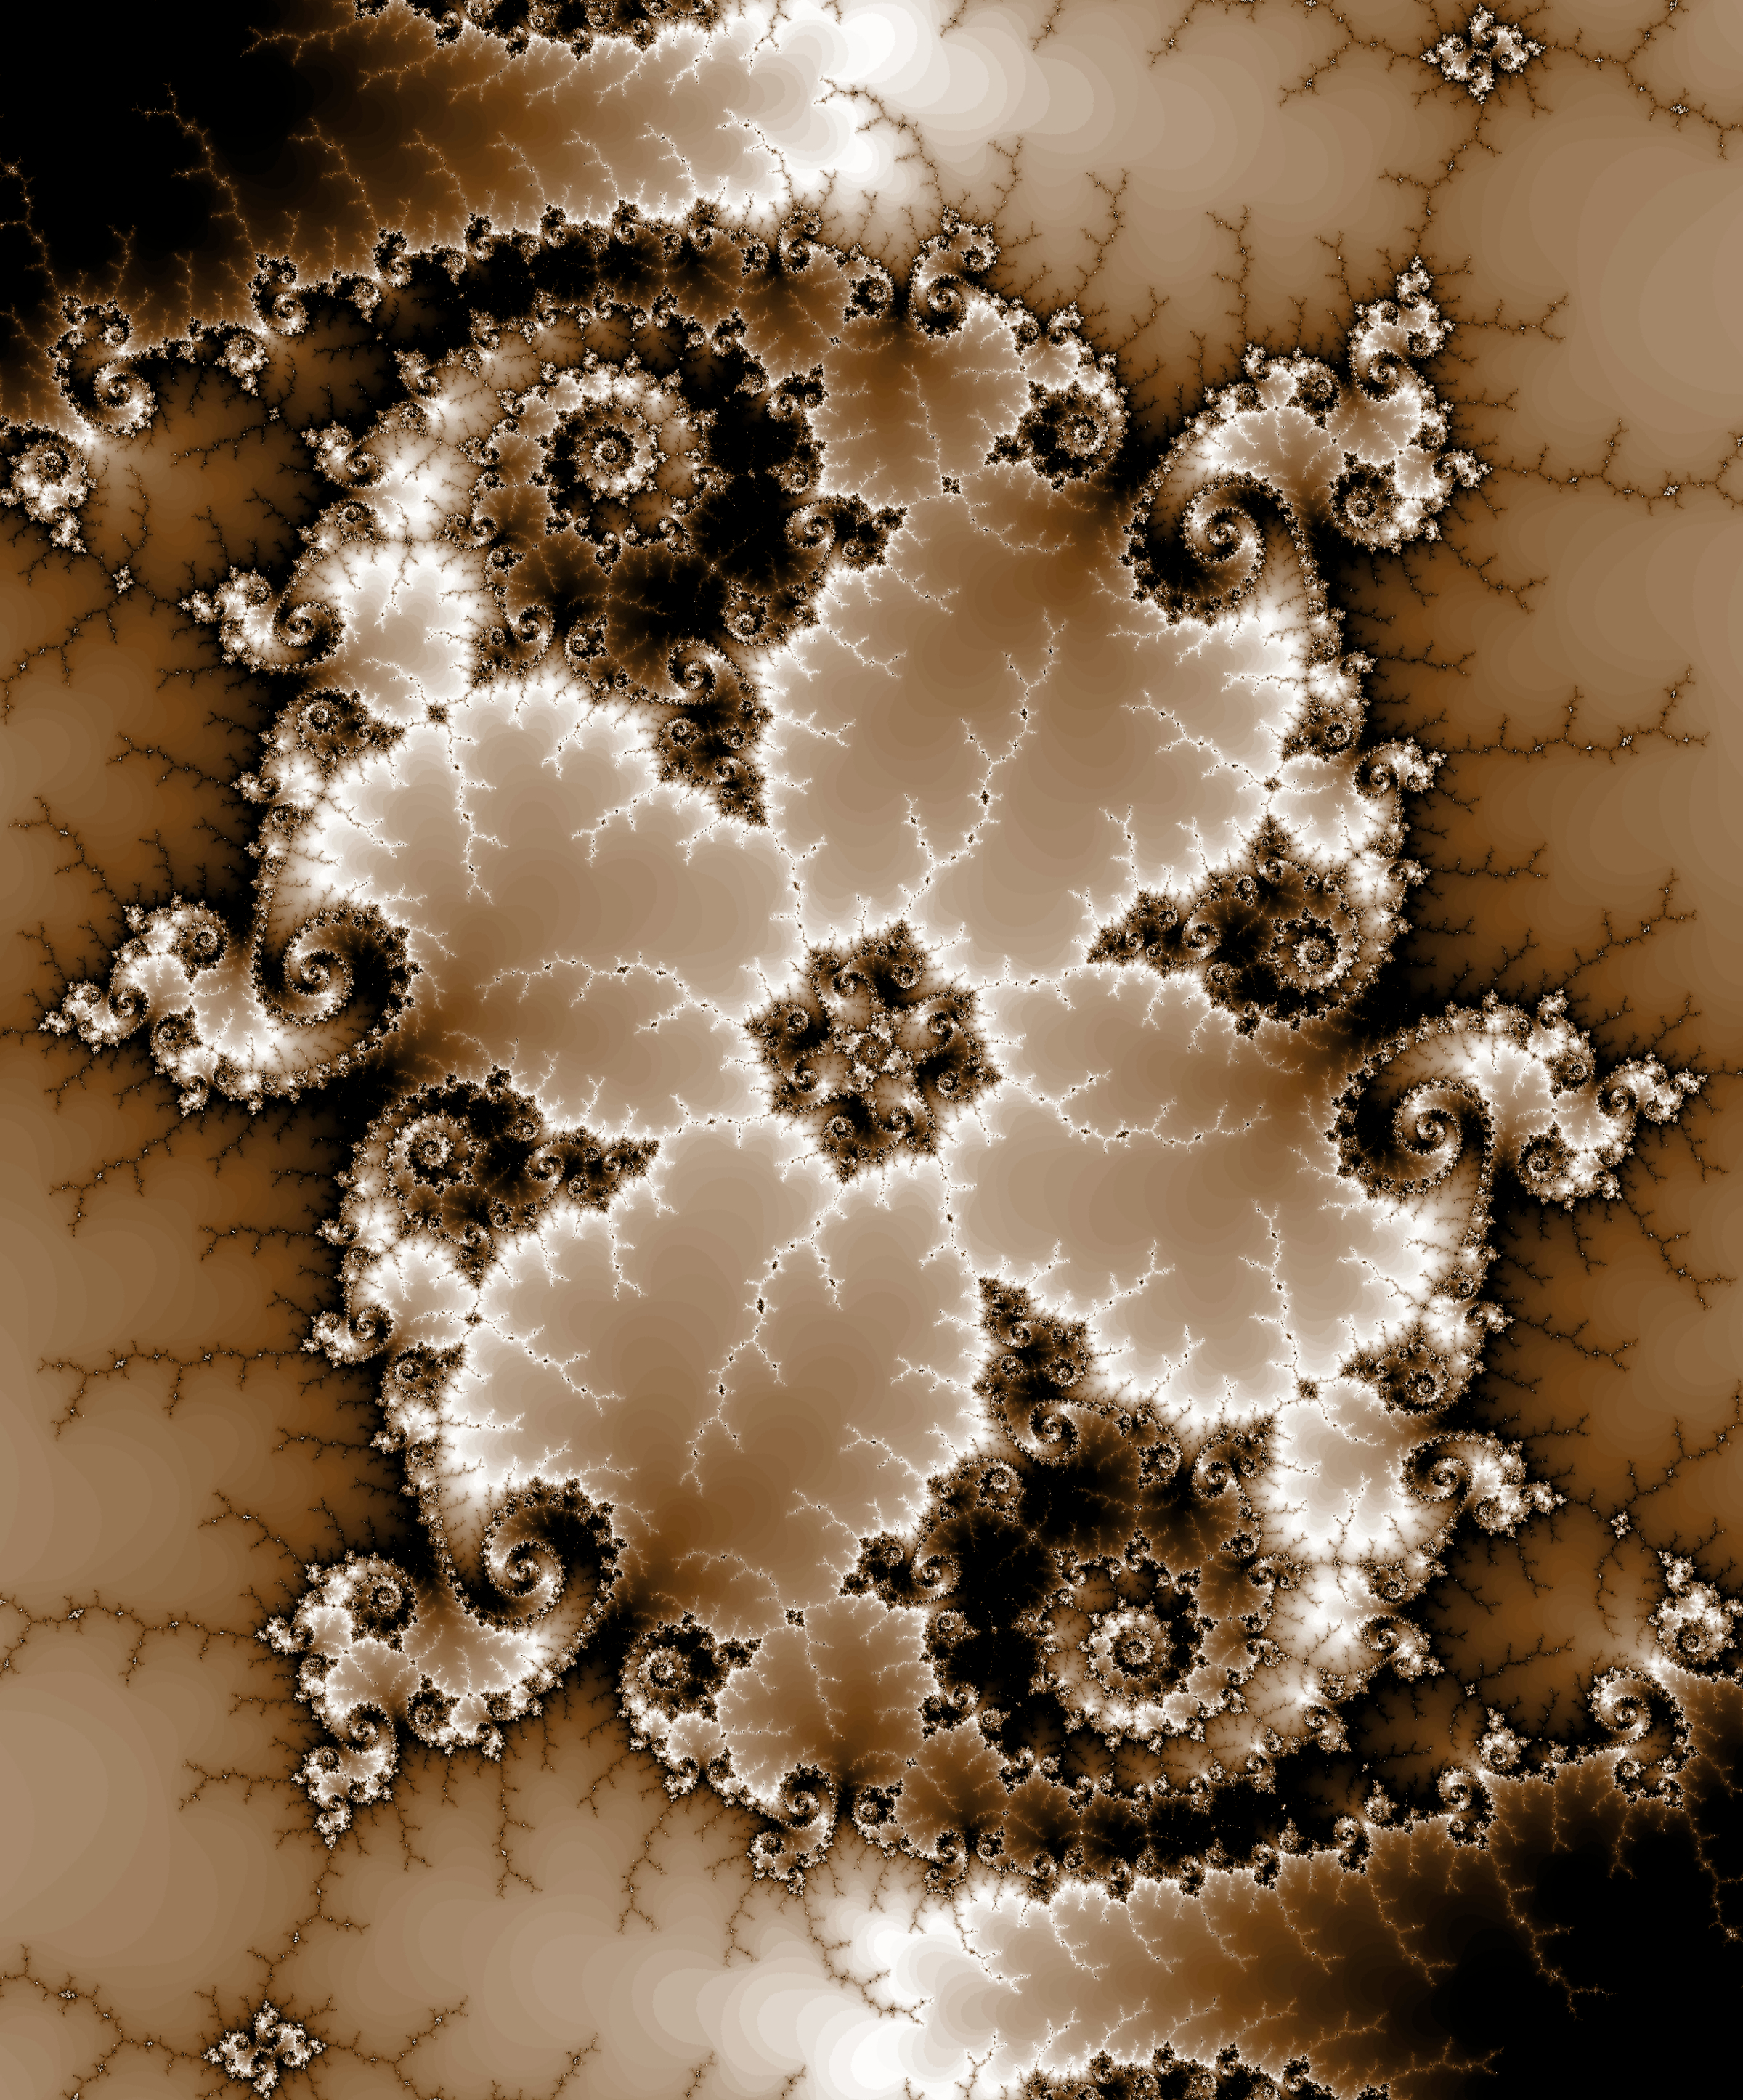
As is clear from my code, I am not the greatest programmer in the world. This week, it was the source of some frustration—I was chasing down some interesting structures near \(-0.161+1.037i\), but quickly ran into the limits of double precision floating point variables. In the larger version of the above image, zooming the image to the point where individual pixels are visible reveals the problem. That said, the image works well as a whole. I just need to figure out how to get better precision. ;)
I have been interested in the Mandelbrot set for some time. I know how to create images using the standard escape time coloring scheme using MATLAB and compiled code, but I want to be able to create smoothly colored images. I get the impression from some of what I have read that it is not practically possible to make something that is truly smoothly colored, but I have seen images that are close. What I have read talks about a renormalized/normalized iteration count. However, I have been unable to implement this. I am a relatively proficient C programmer and I have access to MATLAB R2008a and Mathematica 7. Do you know how I might do this? And how do you create your images?
Unfortunately, I am not a terribly proficient programmer in any language. I started playing around with the Mandelbrot set because it seemed like a good way to teach myself a little C. My method for getting somewhat smoothly colored images is to render a very large bitmap, then scale it down by at least half in order to (effectively) anti-alias the image and remove most of the bands. This isn’t perfect, but it does a reasonably good job. As to how I create my images, the code is attached to this post, and linked in the first paragraph. It is not highly commented, but I hope it should be clear. If nothing else, you can point and laugh at my amateur efforts. ;)
With regard to coloring, the general idea is to treat the complex plane as a metric space. That is, from any point on the plane, we can measure the distance to another point. Specifically, we are interested in the distance from a particular point of interest to a point in the Mandelbrot set. One way to measure this distance is to count the number of iterations until the point “escapes” (i.e. the escape time algorithm). Other estimators of distance look at nth iteration and see where it ended up. The father from the set the nth term is, the greater the distance from the original point to the Mandelbrot set. These kinds of distance estimators should give a smoother coloring, though I am no expert.
You may want to check out Coloring Dynamical Systems in the Complex Plane by Garcia et al. for further details. The discussion there seems relatively straightforward.