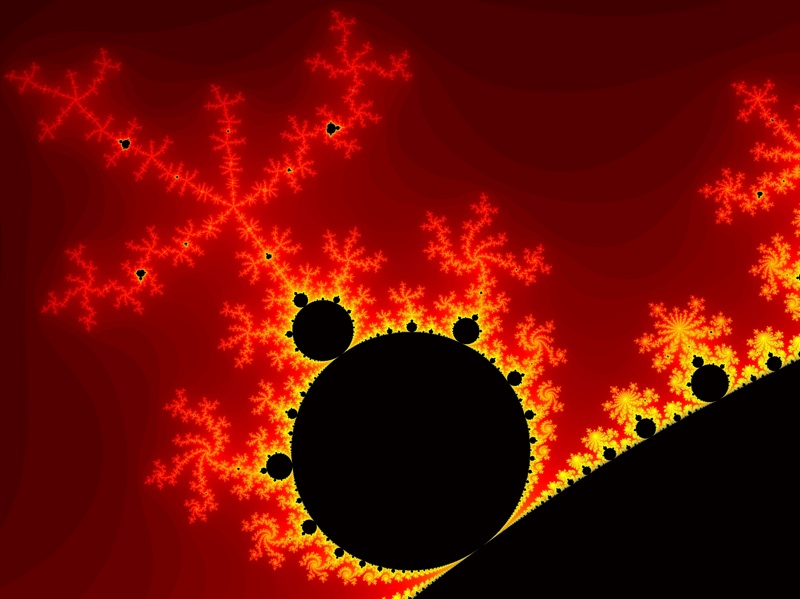
One of my favorite mathematical entities is the Mandelbrot set. It is a mathematical monster that is relatively easy to define and describe (emphasis on relatively), but it is practically impossible to work with or visualize without modern computers.
Not long after I took my first computer programming class at UNR, I started working on a program that could create images of the Mandelbrot set. What I ended up with is amateurish at best, but I do think that it has generated some interesting images.1For those that are interested, the C++ source code is available. The code is ugly, uncommented, and clearly the work of a beginner, so I welcome any comments that anyone has. With regards to copyright: do what you like with the code—it is a part of the public domain as far as I am concerned. In order to share some of these images, I am inaugurating a series of posts called Monday Mandelbrot Madness (MMM). Each post in the series will contain one or two pretty pictures of the Mandelbrot set, and include a description of the region of the complex plane pictured.
If that doesn’t make any sense, please stay tuned. In the near future, I plan to spend some time explaining the Mandelbrot set and its more interesting properties.
Image Details
The image above is a scaled and cropped portion of a much larger image (the linked file is approximately 6MB). The smaller image displays the region \([-0.638,-0.378]\times[0.515,0.710]\), while the larger image displays the region \([-0.638,-0.120]\times[0.515,0.710]\). For the very observant, this is the same region (more or less) displayed in the banner image at the top of every page.
