
The Mandelbrot Set Series:
This post is the fourth in a series on the Mandelbrot set. In previous posts, we have discussed what fractals are, given a hint as to the complexity of the Mandelbrot set, and laid some groundwork on the complex plane. Now we are finally ready to actually define the Mandelbrot set.
- Part I: Fractals
- Part II: Exploring the Mandelbrot Set
- Part III: Complex Numbers
- Part IV: Defining the Mandelbrot Set
Set Theory
Set theory forms a major part of the foundation of modern mathematics. In geometry, figures are defined as sets of points. In calculus, limits are defined in terms of the upper and lower bounds of sets of numbers. In algebra, solutions to equations are the sets of numbers which make the equations true. Even the basic numbers that we use for counting are defined in terms of sets. While set theory can get very complicated, the tools that we need are pretty simple. In fact, all we really need to understand is what a set is.
A set is simply a collection of objects. The cows in a field are a set. The grains of sand on the beach are a set. The people on a bus are a set. There is nothing magical about sets or the objects that they contain. As illustrated above, they can be very mundane.
Mathematicians are generally concerned with what kinds of objects belong to a particular set, and what kinds of objects do not belong to that set. For instance, consider the set made up of people who have been president of the United States. George Washington and Franklin Roosevelt would belong to that set, as each of them was president of US at some point in history. In mathematical language, Washington and Roosevelt are members, or elements, of the set of US presidents. Benjamin Franklin, on the other hand, was never a US president, so he is not a member of the set. This set would also exclude granite, the color orange, and pink unicorns.
To consider a more mathematical example, consider the set of numbers less than 10. Obviously, this set contains only numbers. This means that anything that is not a number is not a member of the set. Immediately, we can throw out the word “attic,” ponies, and the act of chasing a small child around the garden with an orange wedged in your mouth. We only need to consider numbers, as the only thing in our set is numbers.
More specifically, numbers that are less than 10. We can take any number that we can think of, and put it either in our set, or toss it out with the orange eating Mafia kingpins. For example, 3 is in our set. So are -1, \(\pi\), and \(7\frac{1}{2}\). On the other hand, 27 is not in our set. Neither are 96.8, 365, nor a googol. The number 10 is also excluded from our set, because 10 is equal to 10, not less than 10.
The important piece to remember is that however we define a set, any object that we can name will either be an element of the set, or it will not be an element of the set.
Defining the Mandelbrot Set
The Mandelbrot set is a set of complex numbers. We can take any complex number and, with a few manipulations, determine that the chosen number is either an element of the Mandelbrot set, or not. So how, exactly, do we decide which complex numbers to keep, and which ones to throw away?
The process is actually relatively simple. We pick some number in the complex plane and call it \(c\). Then we define the following sequence: let \(z_0 = c\), and let \(z_{n+1} = z_n^2 + c\). In more or less plain English, we are defining a sequence (an ordered list of numbers). We are going to take our chosen number as the first term of the sequence. Then, to get the second term in the sequence, we square the first term, then add our chosen number. To get the third term, we square the second term and add \(c\). And so on.
At each step of the process, we are taking a complex number as the input, and getting a complex number as the output. In the last post in this series, we stated that complex numbers could be plotted on the complex plane. So if we wanted, we could start with some different values for \(c\), plot them on the complex plane, and see what happens.
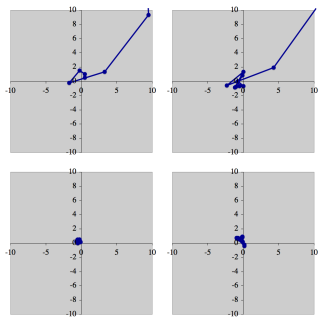
Starting in the top left, and going clockwise, the initial points are \((0.5,0.5)\), \((-0.5,-0.7)\), \((-0.5,0.5)\), and \((-0.1,0.9)\). Look at the top two pictures and notice that the lines extend beyond the boundaries of the graphs. Then look at the bottom two pictures and note that the lines stay very near to the origin (i.e. the point \((0,0)\)). These four graphs imply that there are two possible behaviours: either the terms of the sequence will stay near the origin, or they will diverge away from the origin.
This behaviour dictates which numbers are members of the Mandelbrot set, and which are not. The Mandelbrot set contains all of the complex numbers that stay near the origin when the above sequence is applied. For practical purposes, “near the origin” means that no term of the sequence leaves a circle around the origin with radius 2. If we plot a term and it lands outside of that circle, then subsequent terms are just going to get farther and farther away.
Here is where we run into a couple of problems. First, there are an infinite number of points on the complex plane. We cannot possibly examine every single complex number and apply the above sequence. And when we say it is not possible, we mean that there isn’t even a theoretical way to make it happen. There are just too many numbers. It can’t be done, no way, no how.
Second, there are a lot of starting numbers where the sequence will bounce around inside of our circle for a very long time before finally escaping. We could take the sequence to a vary large number of terms, and even then we can’t be sure if our starting point is a member of the Mandelbrot set or not. The only way to be sure is to take the sequence out to an infinite number of terms and this, also, is impossible.
The solutions to both problems are to use approximations. For the problem of taking the sequences out to a bazillion terms, we pick some number and declare it to be “enough” terms for all practical purposes. The actual limit that we pick is somewhat arbitrary, and depends upon what you want to do with the results. Generally speaking, something around 500 is probably more than enough.
In order to deal with the infiniteness of the complex plane, we are going to divide the plane in to square regions. Basically, we are going to put a grid over the plane. First let us consider squares that are two units in length. We will center one square at the origin, and build out from there. The grid looks like this:
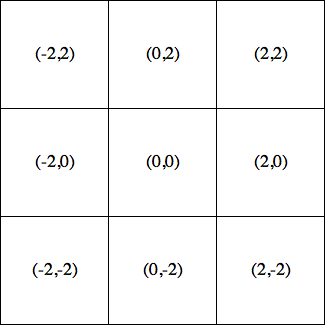
In this image, each square is labeled by its center point. There are nine squares, and for each one, we can calculate the first several terms of the series. If we plot those terms, we get the following:
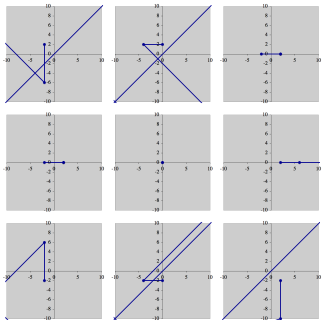
In each plot, we have started at the center of the corresponding square, and gone out to the 10th term in the sequence. In most of the squares, the sequence quickly escapes from our circle of radius 2. However, in two of the plots (those for \((-2,0)\) and \((0,0)\)), the sequence stays very close to the origin. These two complex numbers (\((-2,0)\) and \((0,0)\)) are both elements of the Mandelbrot set. If we color these two grid squares black, and leave the remaining squares white, we get the following:
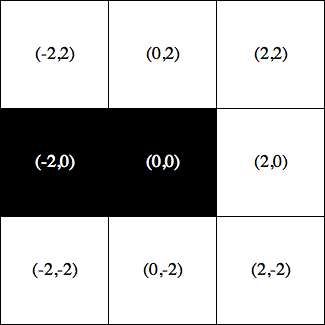
This image is a picture of the Mandelbrot set. It is, however, very low resolution—we have divided a region that is four units on a side into just 9 pieces. What happens if we divide it into more pieces?
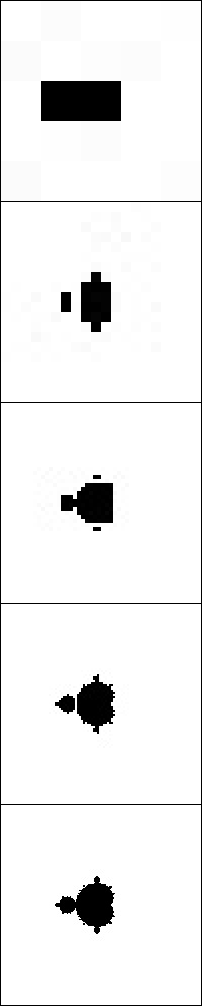
All five of the above images show exactly the same part of the complex plane as the first grid above. However, they are shown with increasingly high resolution. The top image uses a \(5\times 5\) grid. The next images, from top to bottom, use a \(20\times 20\) grid, a \(50\times 50\) grid, a \(100\times 100\) grid, and a \(200\times 200\) grid. We should also note that each of these images takes the sequence out to 512 terms before it declares that a number is a part of the Mandelbrot set. This is in contrast to the first grid of numbers, where we only took the sequence out to the 10th term.
It is interesting to know that these images are basically impossible without the advent of modern computers. Consider even the second image in the series. The grid placed over that image is 20 squares by 20 squares, meaning that it contains a total of 400 squares. For each one of those 400 squares, we need to generate several terms of a sequence. In fact, we could end up generating 512 terms of the sequence if the center of the square is in the Mandelbrot set. Each term of the sequence requires 7 computations to find, so generating that images took between 2,800 and 1,433,600 (the actual number of computations required is probably around 100,000). Assuming that we can perform one computation every 3 seconds, it would take something on the order of three and a half days to generate the second image in this sequence.
Conclusion
The Mandelbrot set is simply a collection of complex numbers. For any complex number \(c\), we determine whether or not \(c\) is an element of that collection by repeatedly applying a particular procedure in order to generate a sequence. If that sequence diverges from the origin, then \(c\) is not a member of the Mandelbrot set. If, on the other hand, the sequence stays near the origin, then \(c\) is a member of the Mandelbrot set.
As each complex number can be represented as a point on the complex plane, it is possible to create a graphical representation of the Mandelbrot set. This is done by dividing the complex plane into a grid of squares, then testing one number in each square (usually the center) to see if it is in the Mandelbrot set. If it is, we color the square black; otherwise, we color the square white.
That, in a nutshell, is the Mandelbrot set.