Every Monday for the past several weeks, I have posted an image under the heading Monday Mandelbrot Madness. I have offered up these images largely on aesthetic grounds, and offered very little in the way of mathematical explanation. There are two reasons for this: I want readers to be able to appreciate the images on purely aesthetic grounds; and I have been planning a series of posts which explain the images in greater detail. This is the first such post.
The Mandelbrot set is a fractal. In this post, my intention is to introduce the reader to the concept of a fractal, and to provide a couple of examples. In future posts, I will spend some more time discussing the Mandelbrot set specifically.
So, what is a fractal?
While fractals are a diverse group of objects, they are defined, more or less, by self-similarity at all scales. While the actual definition is a bit technical, the basic idea is that if you have an image of a fractal, you can zoom in on that image, and find a smaller version of the original image. The smaller image need not be an exact replica of the original, but it should be pretty close.
If this is not entirely clear, let us consider the Koch snowflake. In order to create a Koch triangle, we begin with an equilateral triangle:
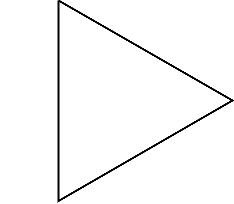
We could think of this as simply an equilateral triangle, but it might be more helpful to think of it as the 0th iteration of the Koch snowflake. For each additional iteration, we will do the following: first, remove the middle third of every line segment in the image, then fill in the gap with an equilateral triangle. So to get from the first iteration to the second iteration, we would first remove the middle of each side of the triangle, then replace each missing segment with an equilateral triangle. The result looks like this:
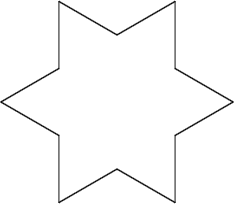
The above image is the 1st iteration of the Koch snowflake. The 2nd through 4th iterations are shown below.
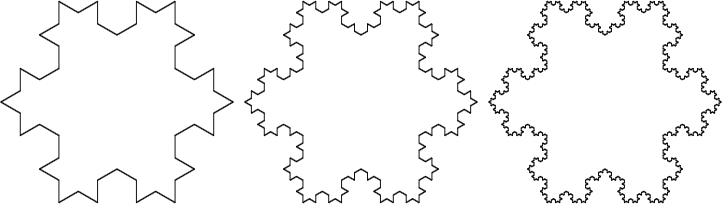
At this point, we have a pretty interesting picture, and we can see why it is called a snowflake, but it isn’t actually a fractal yet. It becomes a fractal only when we repeat the process an infinite number of times. 1To be mathematically correct, we repeat the process \(n\) times, where \(n\) is larger than any finite number \(N\). However, once we repeat the process to its limit, interesting things start to happen.
For instance, consider a section of the snowflake, as depicted below. Then zoom in (i.e. enlarge just the rectangle highlighted in red—note that I have omitted a great deal of detail for the sake of clarity). The zoomed image is identical to the original image!
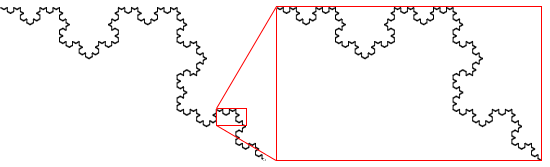
Hopefully, the Koch snowflake makes it clear what is meant by self-similarity at every scale—no matter how far we zoom in on any particular portion of the snowflake, we will still find more copies of the unzoomed portion (with allowances made for rotation). However, just to muddy the waters a bit, note that self-similarity need not necessarily indicate that the fractal is identical to itself at all levels. It just means that the structures seen at one scale are similar to the structures seen at another scale.
The obvious question to ask at this point is, “So what? Why are these things interesting?” Aside from the (hopefully) obviously pleasing aesthetics of fractals, they have some interesting mathematical properties which make fractals very difficult to study using standard geometrical techniques.
For instance, think back to your high school geometry class, or to your geometry instruction in lower grades. There are two measurements that you were probably asked to make for just about every figure you ever encountered: the perimeter, and the area. Just for the hell of it, why don’t we try computing the perimeter and area of the Koch snowflake. If you don’t care to see all of the gory details, just skip the box below.
The perimeter is relatively easy. For any polygon, the perimeter is the sum of the lengths of the sides. That is, we find the perimeter by measuring each side, and adding those measurements together. As the Koch snowflake is a regular polygon (in the sense that each side is the same length), we need two numbers: the length of each side, and the number of sides. The perimeter is then the product of these two numbers.
First, note that each figure is regular, in the sense that each side is the same length. In fact, the length of each side of any particular iteration is \(\frac{1}{3}\) the length of the previous iteration. For instance, if the length of each side of the 0th iteration is \(l\), then the length of each side of the 1st iteration is \(\frac{1}{3}\times l\). The length of each side of the 2nd iteration figure is then \(\frac{1}{3}\times \left(\frac{1}{3}\times l\right) = \left(\frac{1}{3}\right)^2\times l\). In general, the sides of the \(n\)th iteration figure are \(\left(\frac{1}{3}\right)^n\times l\) length. That gives us one piece of the puzzle.
Now for the number of sides. The 0th iteration figure is a triangle, so has 3 sides. To get the 1st iteration figure, we replace each of these three sides with four sides. That is, we break each side into three segments, then remove the middle segment, and replace that with two segments. So the 1st iteration figure has \(3\times 4 = 12\) sides. Each iteration takes each side of the previous iteration, and replaces it with four sides. This implies that the \(n\)th iteration has \(3\times 4^n\) sides.
Let’s put the pieces together: to get the perimeter, we multiply the number of sides and the length of each side. The perimeter of the \(n\)th iteration figure is then
\(\begin{array}{rcl}P&=&\left(\left(\frac{1}{3}\right)^n\times l\right)\times\left(3\times 4^n\right)\\&=&3\times\left(\frac{4}{3}\right)^n\times l.\end{array}\)
Notice that as \(n\) gets larger, \(\left(\frac{4}{3}\right)^n\) gets larger. This means that as \(n\) goes to infinity, the perimeter goes to infinity as well. The boundary of the Koch snowflake is infinitely long!
Next, let’s have a look at the area of the figure. Each of the figures above measures 234 by 204 pixels. This implies that the figure will always fit into a relatively small box, which means that the area is not infinite! In fact, it turns out that area of the Koch snowflake is exactly \(\frac{8}{5}\) the area of the 0th iteration figure. 2The math required to get this result is a little bit hoary, as it involves an infinite series. This is a level of mathematics that is likely to be a bit beyond the average high school graduate, and is thus a bit beyond the intended audience of this wp. However, if you are interested, Wolfram’s MathWorld has the details.
The interesting result here is that the figure is bounded in area—after an infinite number of iterations, the entire figure will still fit into a little box—but has an infinite perimeter. This is really odd. It doesn’t make a lot of sense at first glance, and is one of the reasons that traditional geometrical techniques don’t work very well when trying to understand the Koch snowflake (and other fractals).
The Koch snowflake could be considered to represent a class of fractals consisting of polygons with finite area and infinite perimeter. There are several other classes of fractals, including space filling curves. An example of a space filling curve is the Hilbert curve (the first four iterations of which are shown below).
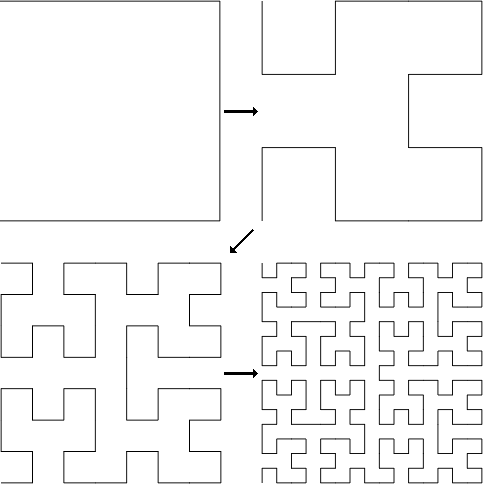
In mathematics, a curve is basically just a line. It can be straight, or curvy, or boxy, but it has only length—not width nor height. Think of a curve as a piece of infinitesimally thin string that is infinitely long. Fold such a string in half, and you still have an infinitely thin string. No matter how many times you fold it in half, you still have an infinitely thin piece of string. You could wrap it around a square or circle, or try to pile it into a box, and it would still be infinitely thin and never have any width.
However, if you are very clever, you can fold the string back and forth on itself into a fractal pattern, and it will fill a square! This is an astonishing result. A curve is one-dimensional, yet somehow, it can be fleshed out to fill a square. This is, in a sense, a contradiction to the definitions of one- and two-dimensional objects.
Once again, we have a fractal that does something totally unexpected and contrary to intuition.
As stated above, fractals have many properties that make them difficult to analyze using traditional techniques. The Koch snowflake has an infinitely long boundary, while the Hilbert curve is a one-dimensional object which occupies a two-dimensional space. Both fractals are continuous at every point, which means that they could be drawn without ever lifting the pencil from the page. There are no gaps. However, neither fractal is differentiable at any point.
Differentiability is a measure of smoothness. Consider the following figure:
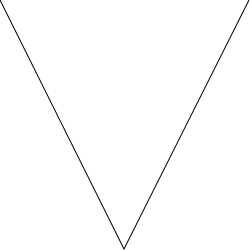
This curve is basically smooth, but it has one point where is suddenly changes direction (the bottom of the V). The curve is differentiable at every point except the bottom of the V—it is differentiable everywhere except for a single point at the corner. Neither the Koch snowflake nor the Hilbert curve is differentiable at any point. In a sense, they are both all corners like the the one pictured above. There are no smooth lines nor segments of lines. Just corners.
Don’t worry if you can’t wrap your head around that concept—it is not an easy thing to imagine and is actually basically impossible to visualize or accurately depict in an image. The important thing to understand is that there is a huge kit of tools that can be used to analyze and understand curves that are continuous and differentiable, but far fewer tools that can be used to understand curves that are continuous but not differentiable. Because these fractals are not differentiable at any point, they are hard to get a handle on.
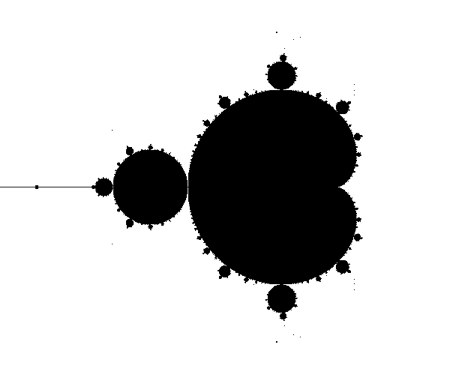
As we move forward into a discussion of the Mandelbrot set, there are a couple of important points to keep in mind. First, fractals are defined in terms of self-similarity. The Mandelbrot set is a fractal because it contains many of the same structures at any “zoom level.” More details can always be exposed by zooming deeper into the fractal, and those details will look much like the details at shallower levels of zoom.
Second, fractals are often generated using iterative processes that are carried through an infinite number of iterations. All of the figures above are simply approximations of processes that will, after an infinite number of steps, produce a fractal. None of the figures above are actually fractals—they are only simplified versions of infinitely more complicated figures that exist only in the abstract.
Finally, fractals are highly resistant to traditional means of analysis. While they can often be described relatively easily, discovering the properties of a fractal can be quite difficult.